

Digging up fossils in your K8s cluster fleet
How to use Omastx to sniff out obsolete images and Helm charts, plus MCP for AI agents
Why do we need it?
Running a single Kubernetes cluster already means managing container images and Helm releases. Running a fleet multiplies the problem: every namespace brings its own workloads and charts with their versions, and the “are we up to date?” doubt becomes a question you answer by opening dashboards, registry UIs, and running helm list one cluster at a time.
Platform teams feel this weight first. Security asks which clusters still run a deprecated Redis tag. Product asks whether the prod-eu and prod-us clusters are aligned. You know something is outdated, but there is no single place that answers: How up to date / obsolete is my fleet?
Commercial fleet tools exist, but they often pull write access, push agents into every cluster, or bury version gaps inside a broader ops product. Homegrown scripts scrape registries and dump CSVs that go stale by lunchtime.
Bottom line: no read-only view that continuously compares what is running against what is latest upstream, across images and Helm charts, with a navigable chart instead of a spreadsheet.
Finding a solution: Omastx
Omastx is an open-source web portal that scans your Kubernetes clusters, discovers container images and Helm releases, resolves the latest upstream versions, and shows the gap as drift classes you can navigate: Current, Patch, Minor, Major, Deprecated, and Unknown. It is read-only by design: even if you connect an admin kubeconfig, Omastx only issues read calls against the Kubernetes API (get/list on workloads and, for Helm releases, on secrets): never create, update, delete, or any other invasive command. Beside the UI, a scoped Bearer API and a thin MCP server let scripts and AI agents (Cursor, Claude, and similar) query the fleet and trigger scans without cluster write access.
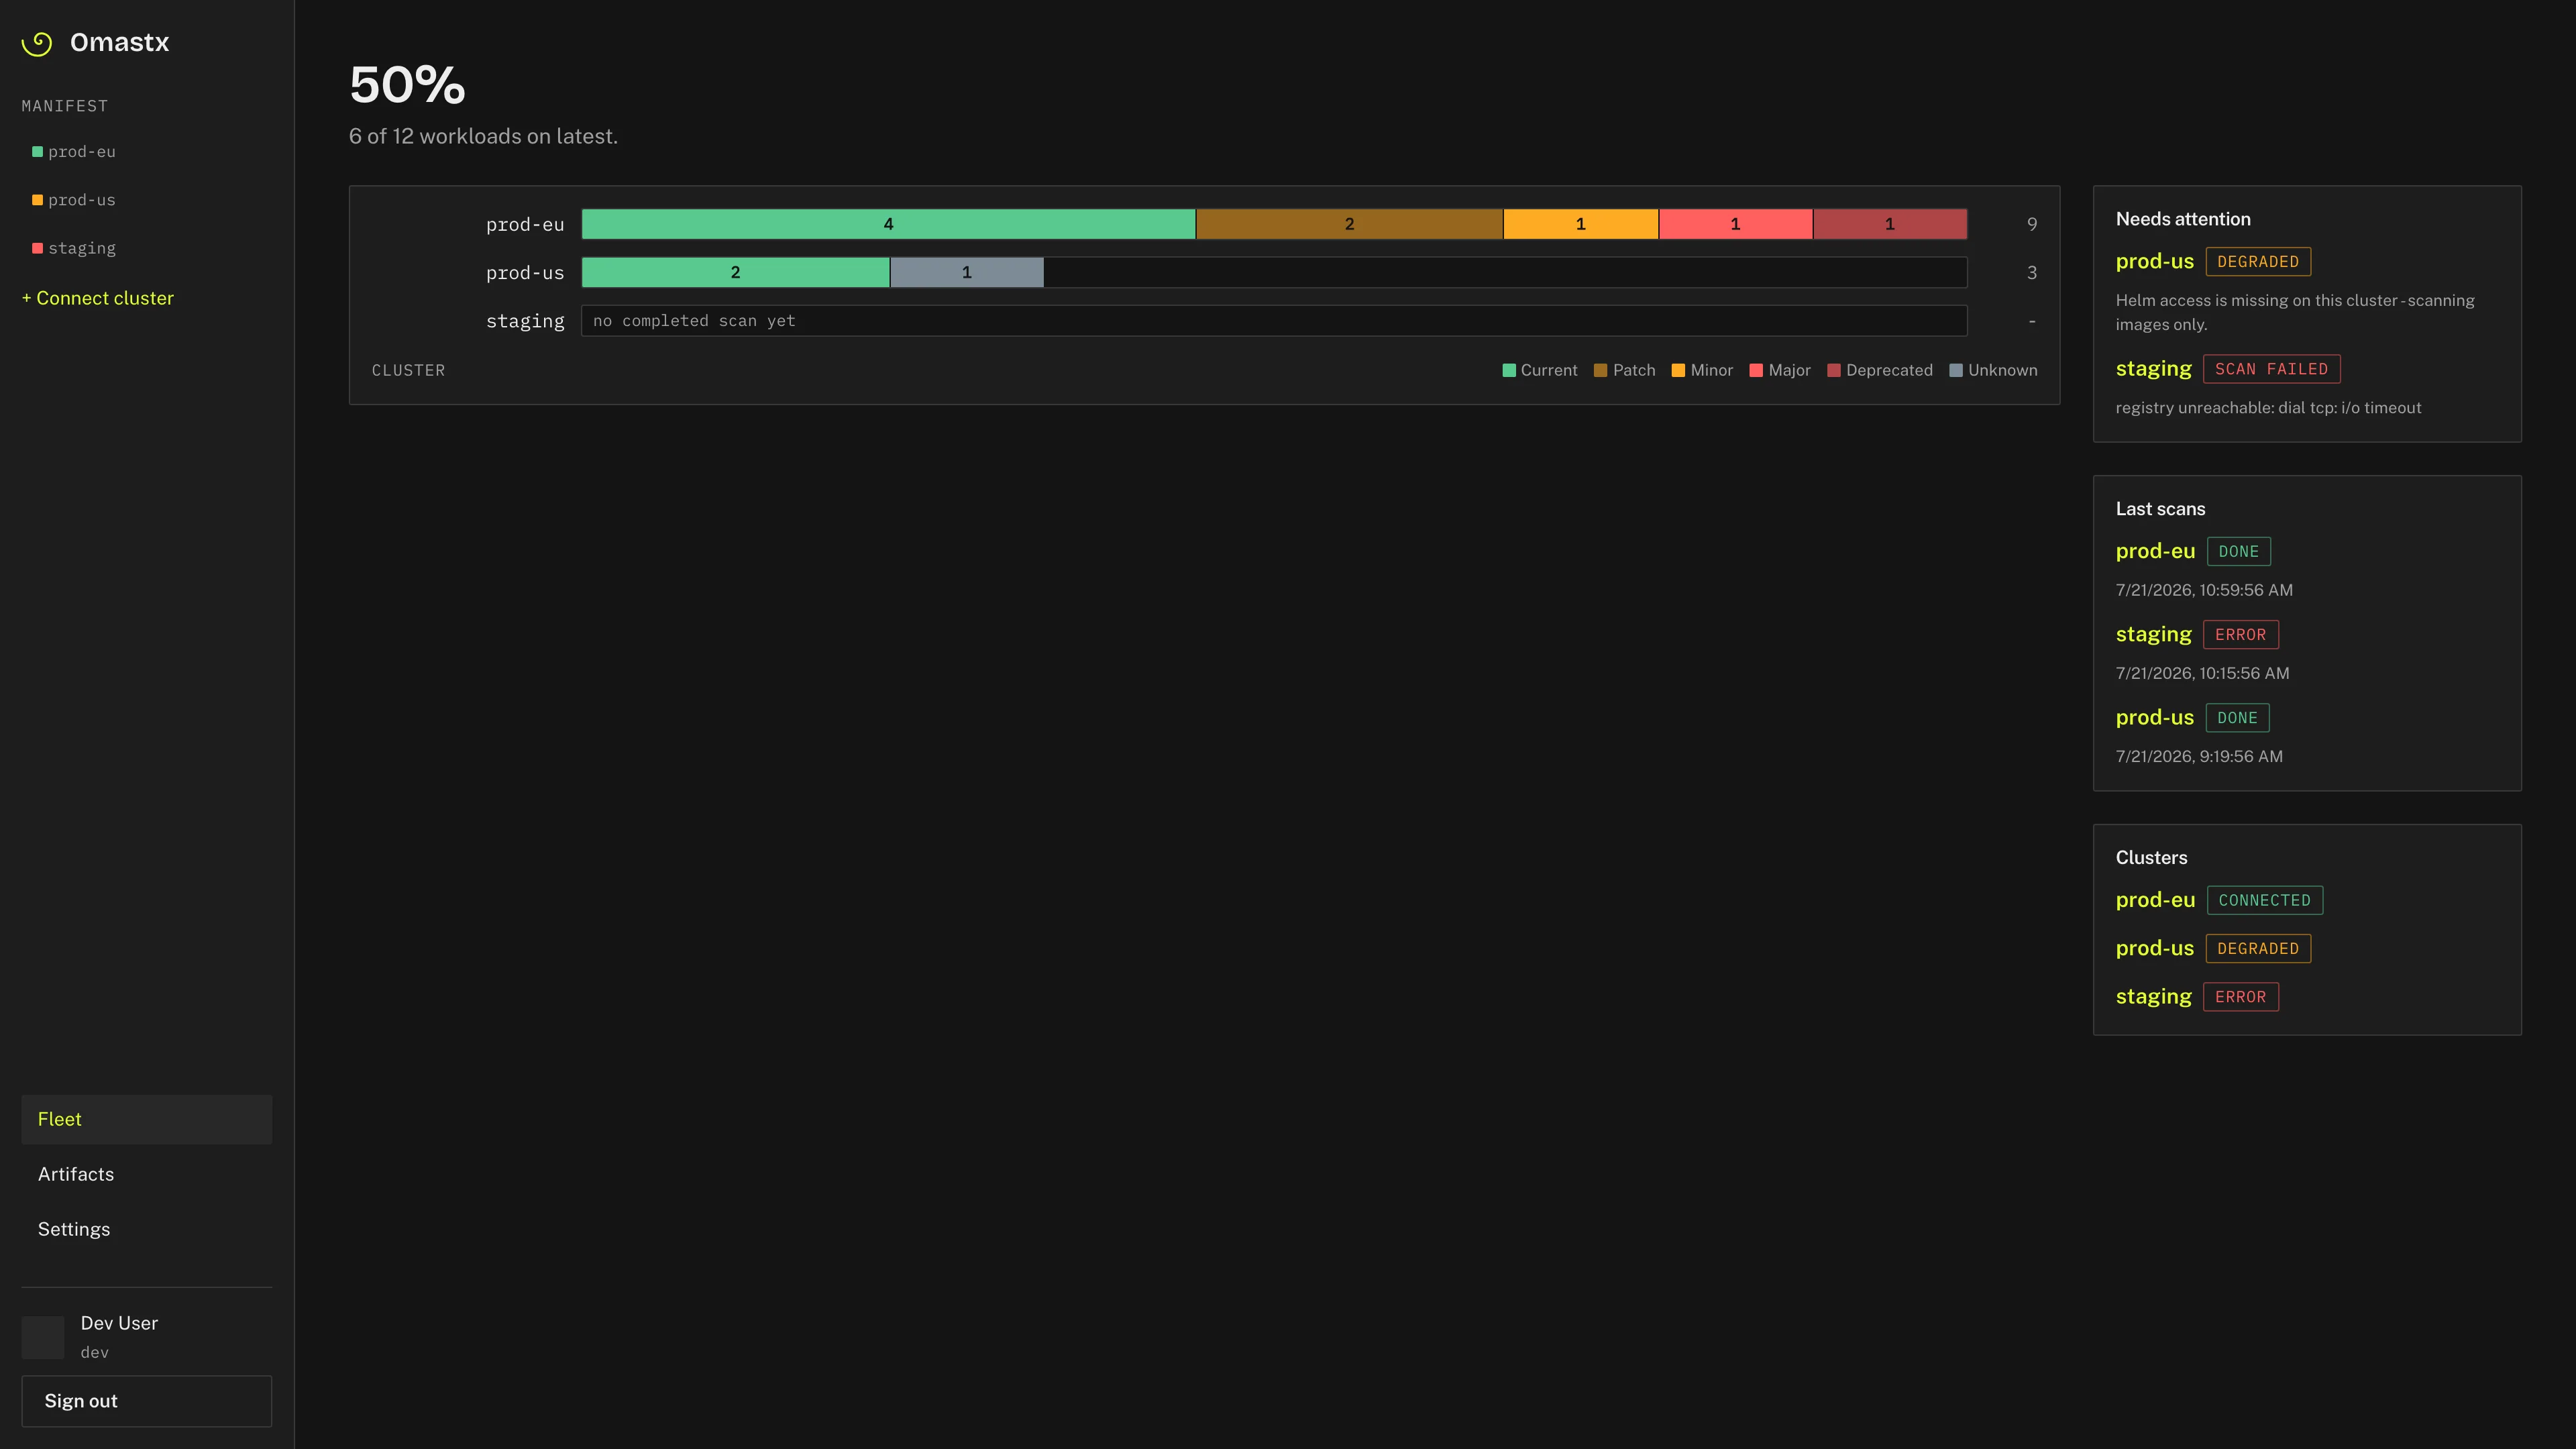 Fleet page: percentage of updated workloads in the headline, stacked drift bars per cluster, and a rail for failures, last scans, and connection status.
What does the dashboard give you?
The Fleet page opens with a single number: the share of workloads still on latest across every connected cluster. Under that, each cluster is a horizontal lane of stacked drift segments. Click a segment and you land in the artifact ledger already filtered to that cluster and drift class. The right rail surfaces what needs attention (degraded clusters, failed scans), recent scan history, and connection health.
Open a cluster and the same chart language zooms to namespace lanes. You see schedule, API server, last scan, a drift breakdown, a short trend, and the mix of images versus Helm charts. Recent scans are clickable: each “View artifacts” link opens the ledger scoped to that scan’s cluster.
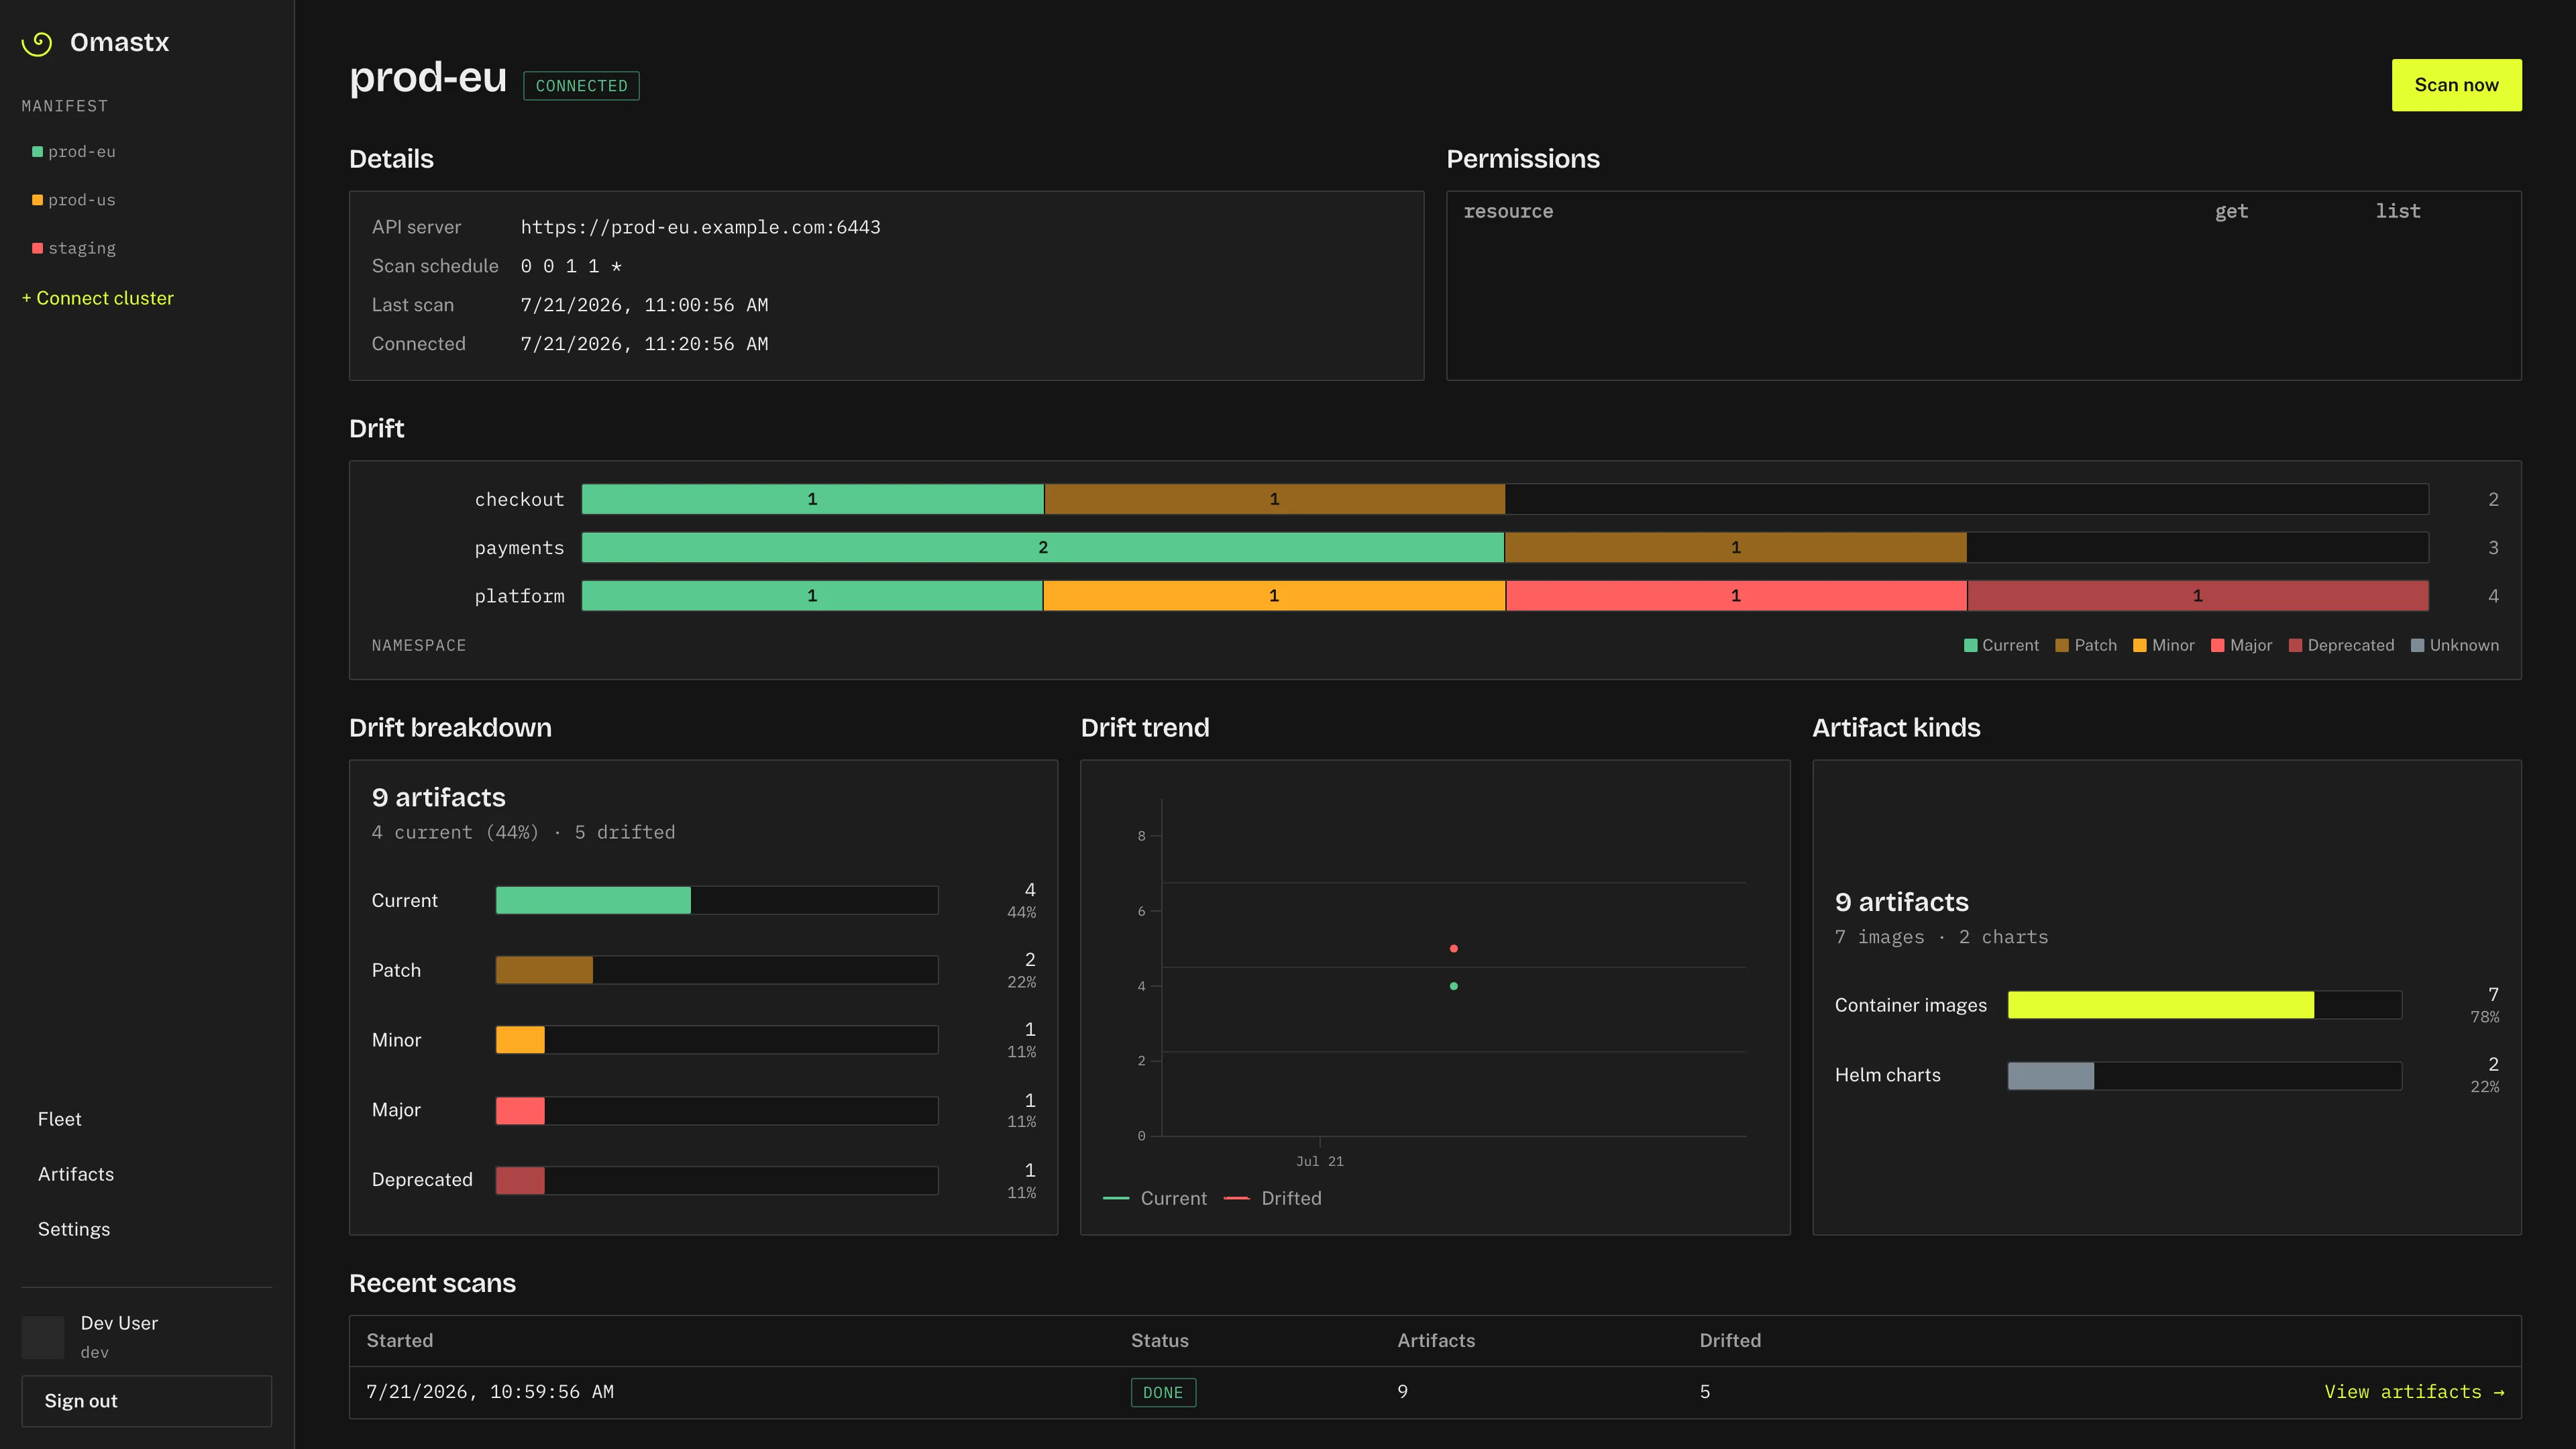 Cluster detail: namespace-level drift bars, analytics cards, and scan history with one-click jump into the ledger.
Not every cluster grants the same RBAC. If secrets access is missing, Omastx stays useful in images-only mode: Helm discovery is skipped, the cluster is marked DEGRADED, and you get a clear banner explaining what permission to add. Unknown drift appears when a registry cannot be resolved (for example a private host without credentials).
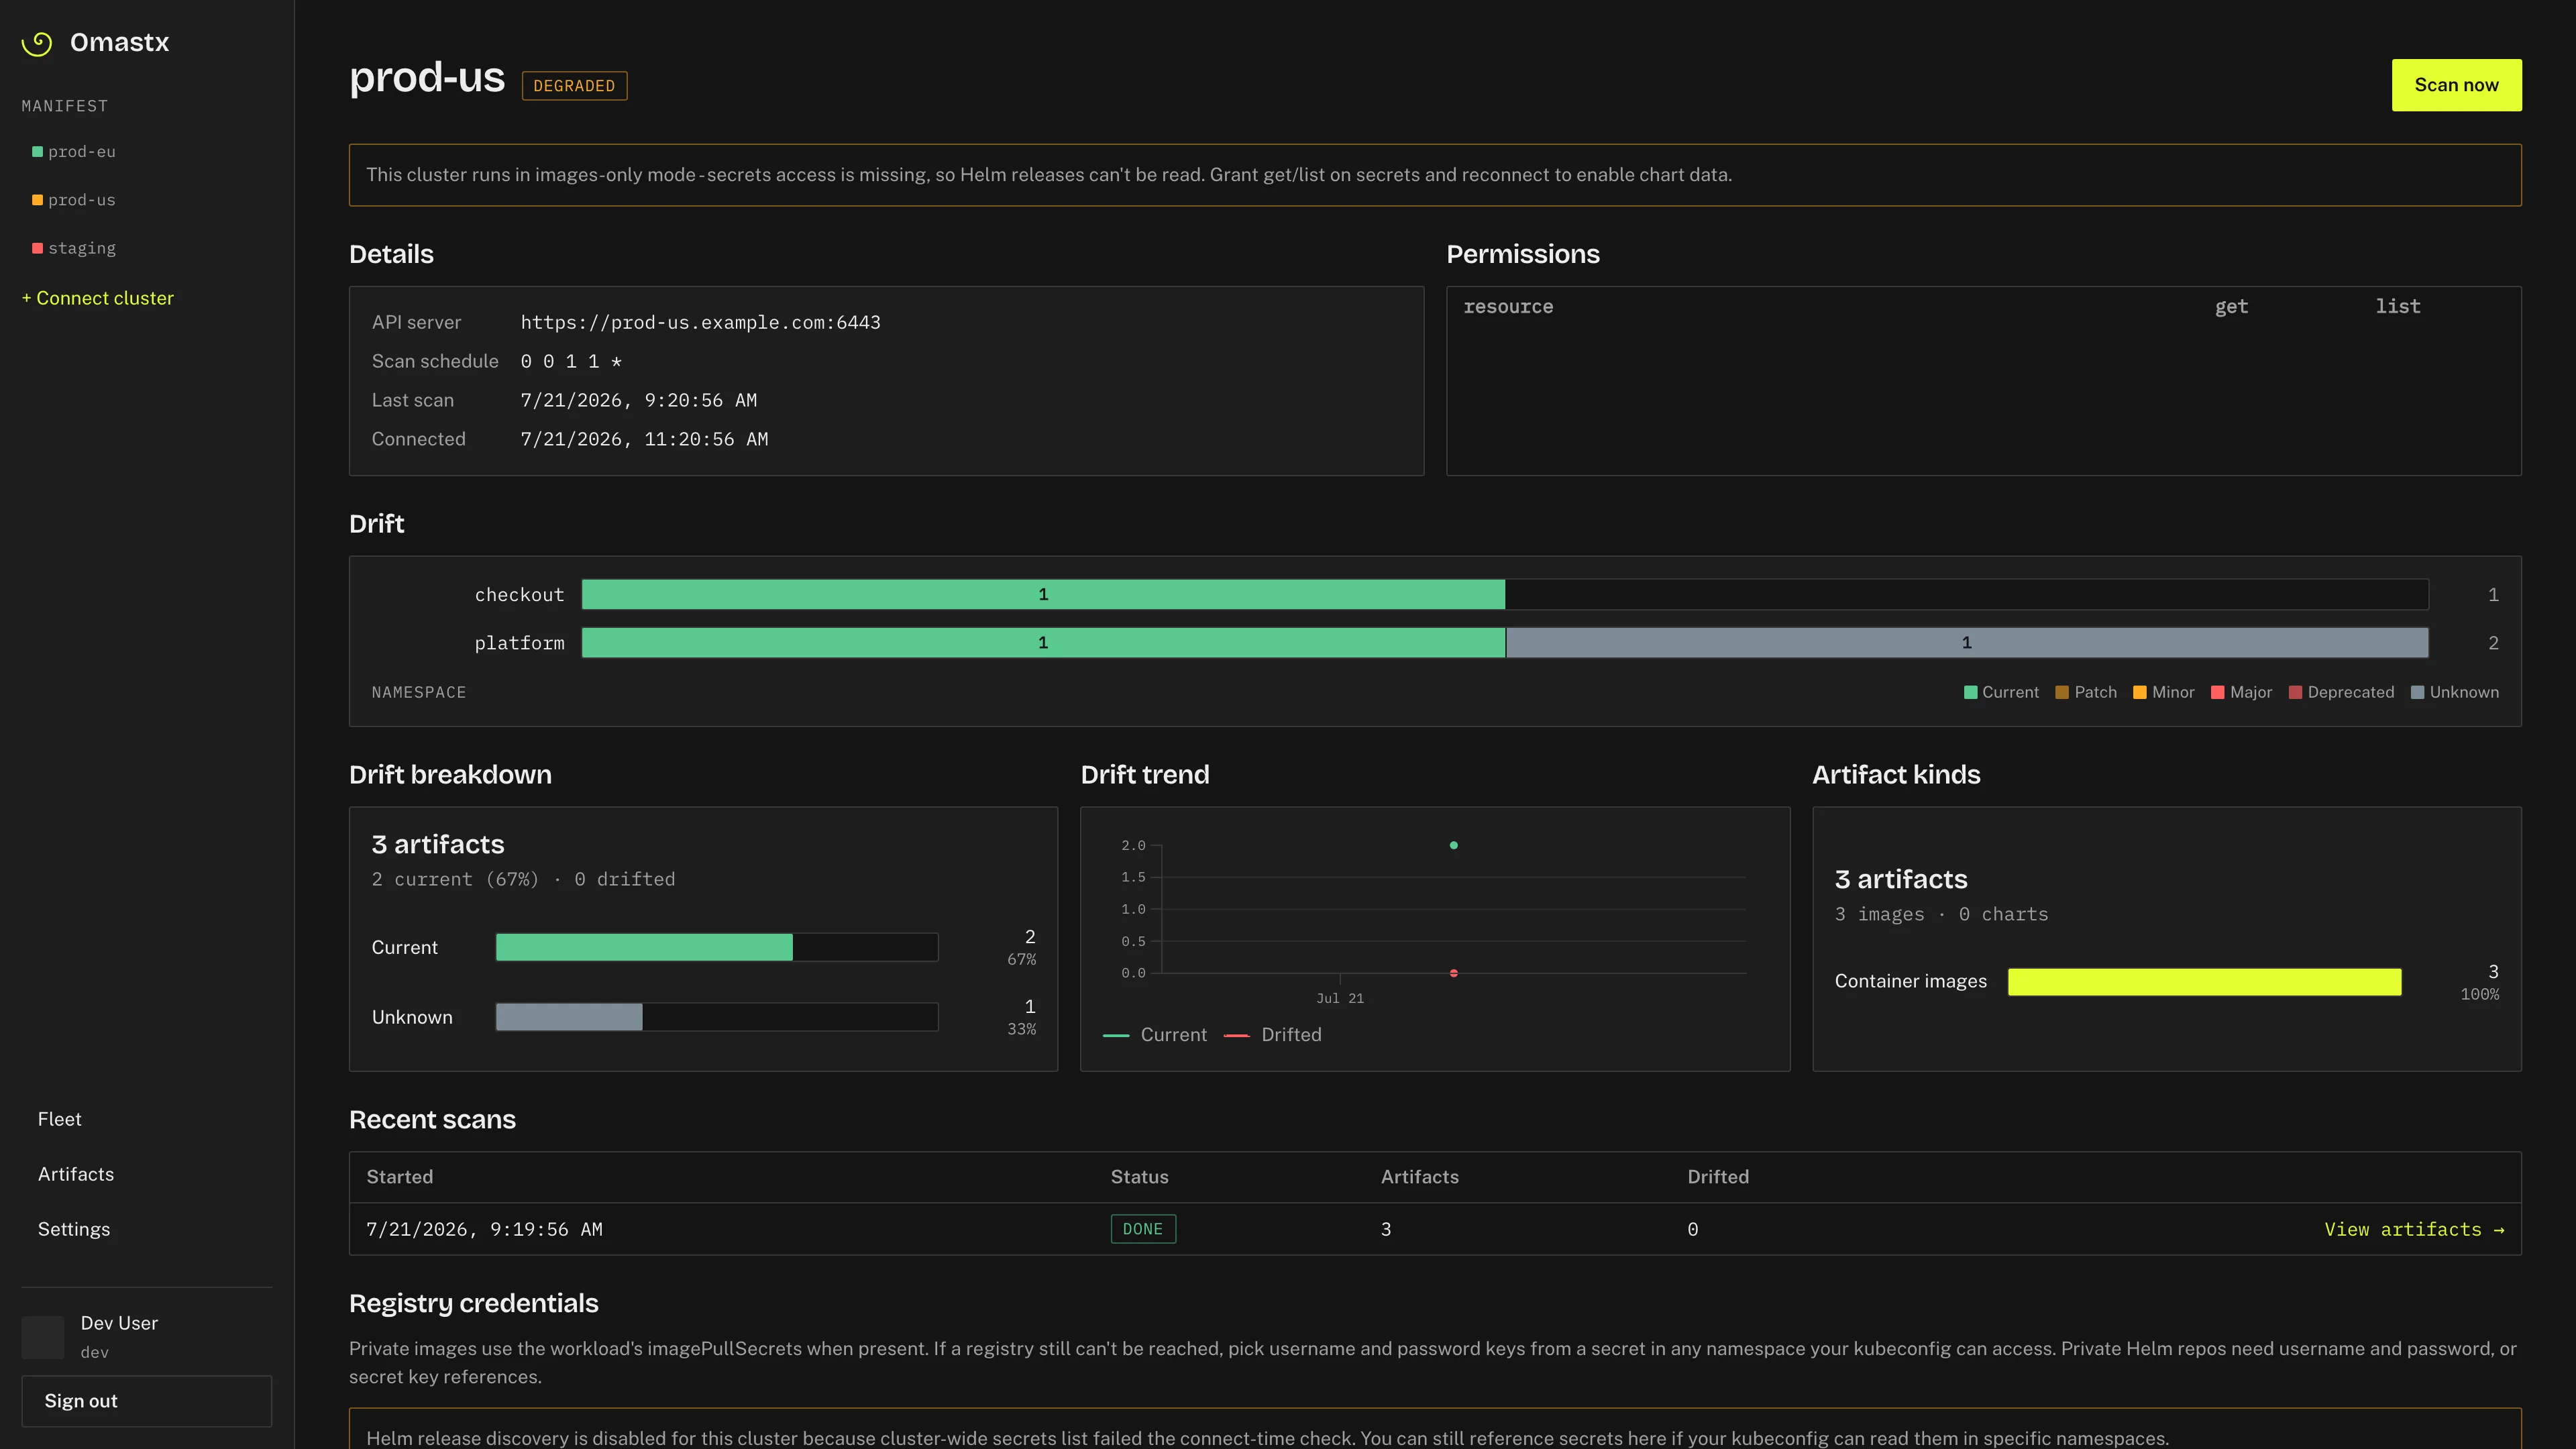 Degraded cluster: Helm access missing, images still scanned, Unknown segment when a registry cannot be resolved.
The Artifacts ledger is the global, filterable list of every discovered image and chart, sorted by how far it has drifted. Filter by cluster, kind (image or chart), drift class, and namespace; search by name. Each row shows installed → latest and a drift badge.
From the same table you can export the filtered result as CSV or PDF. Active filters apply to both formats: what you see in the table is what lands in the file.
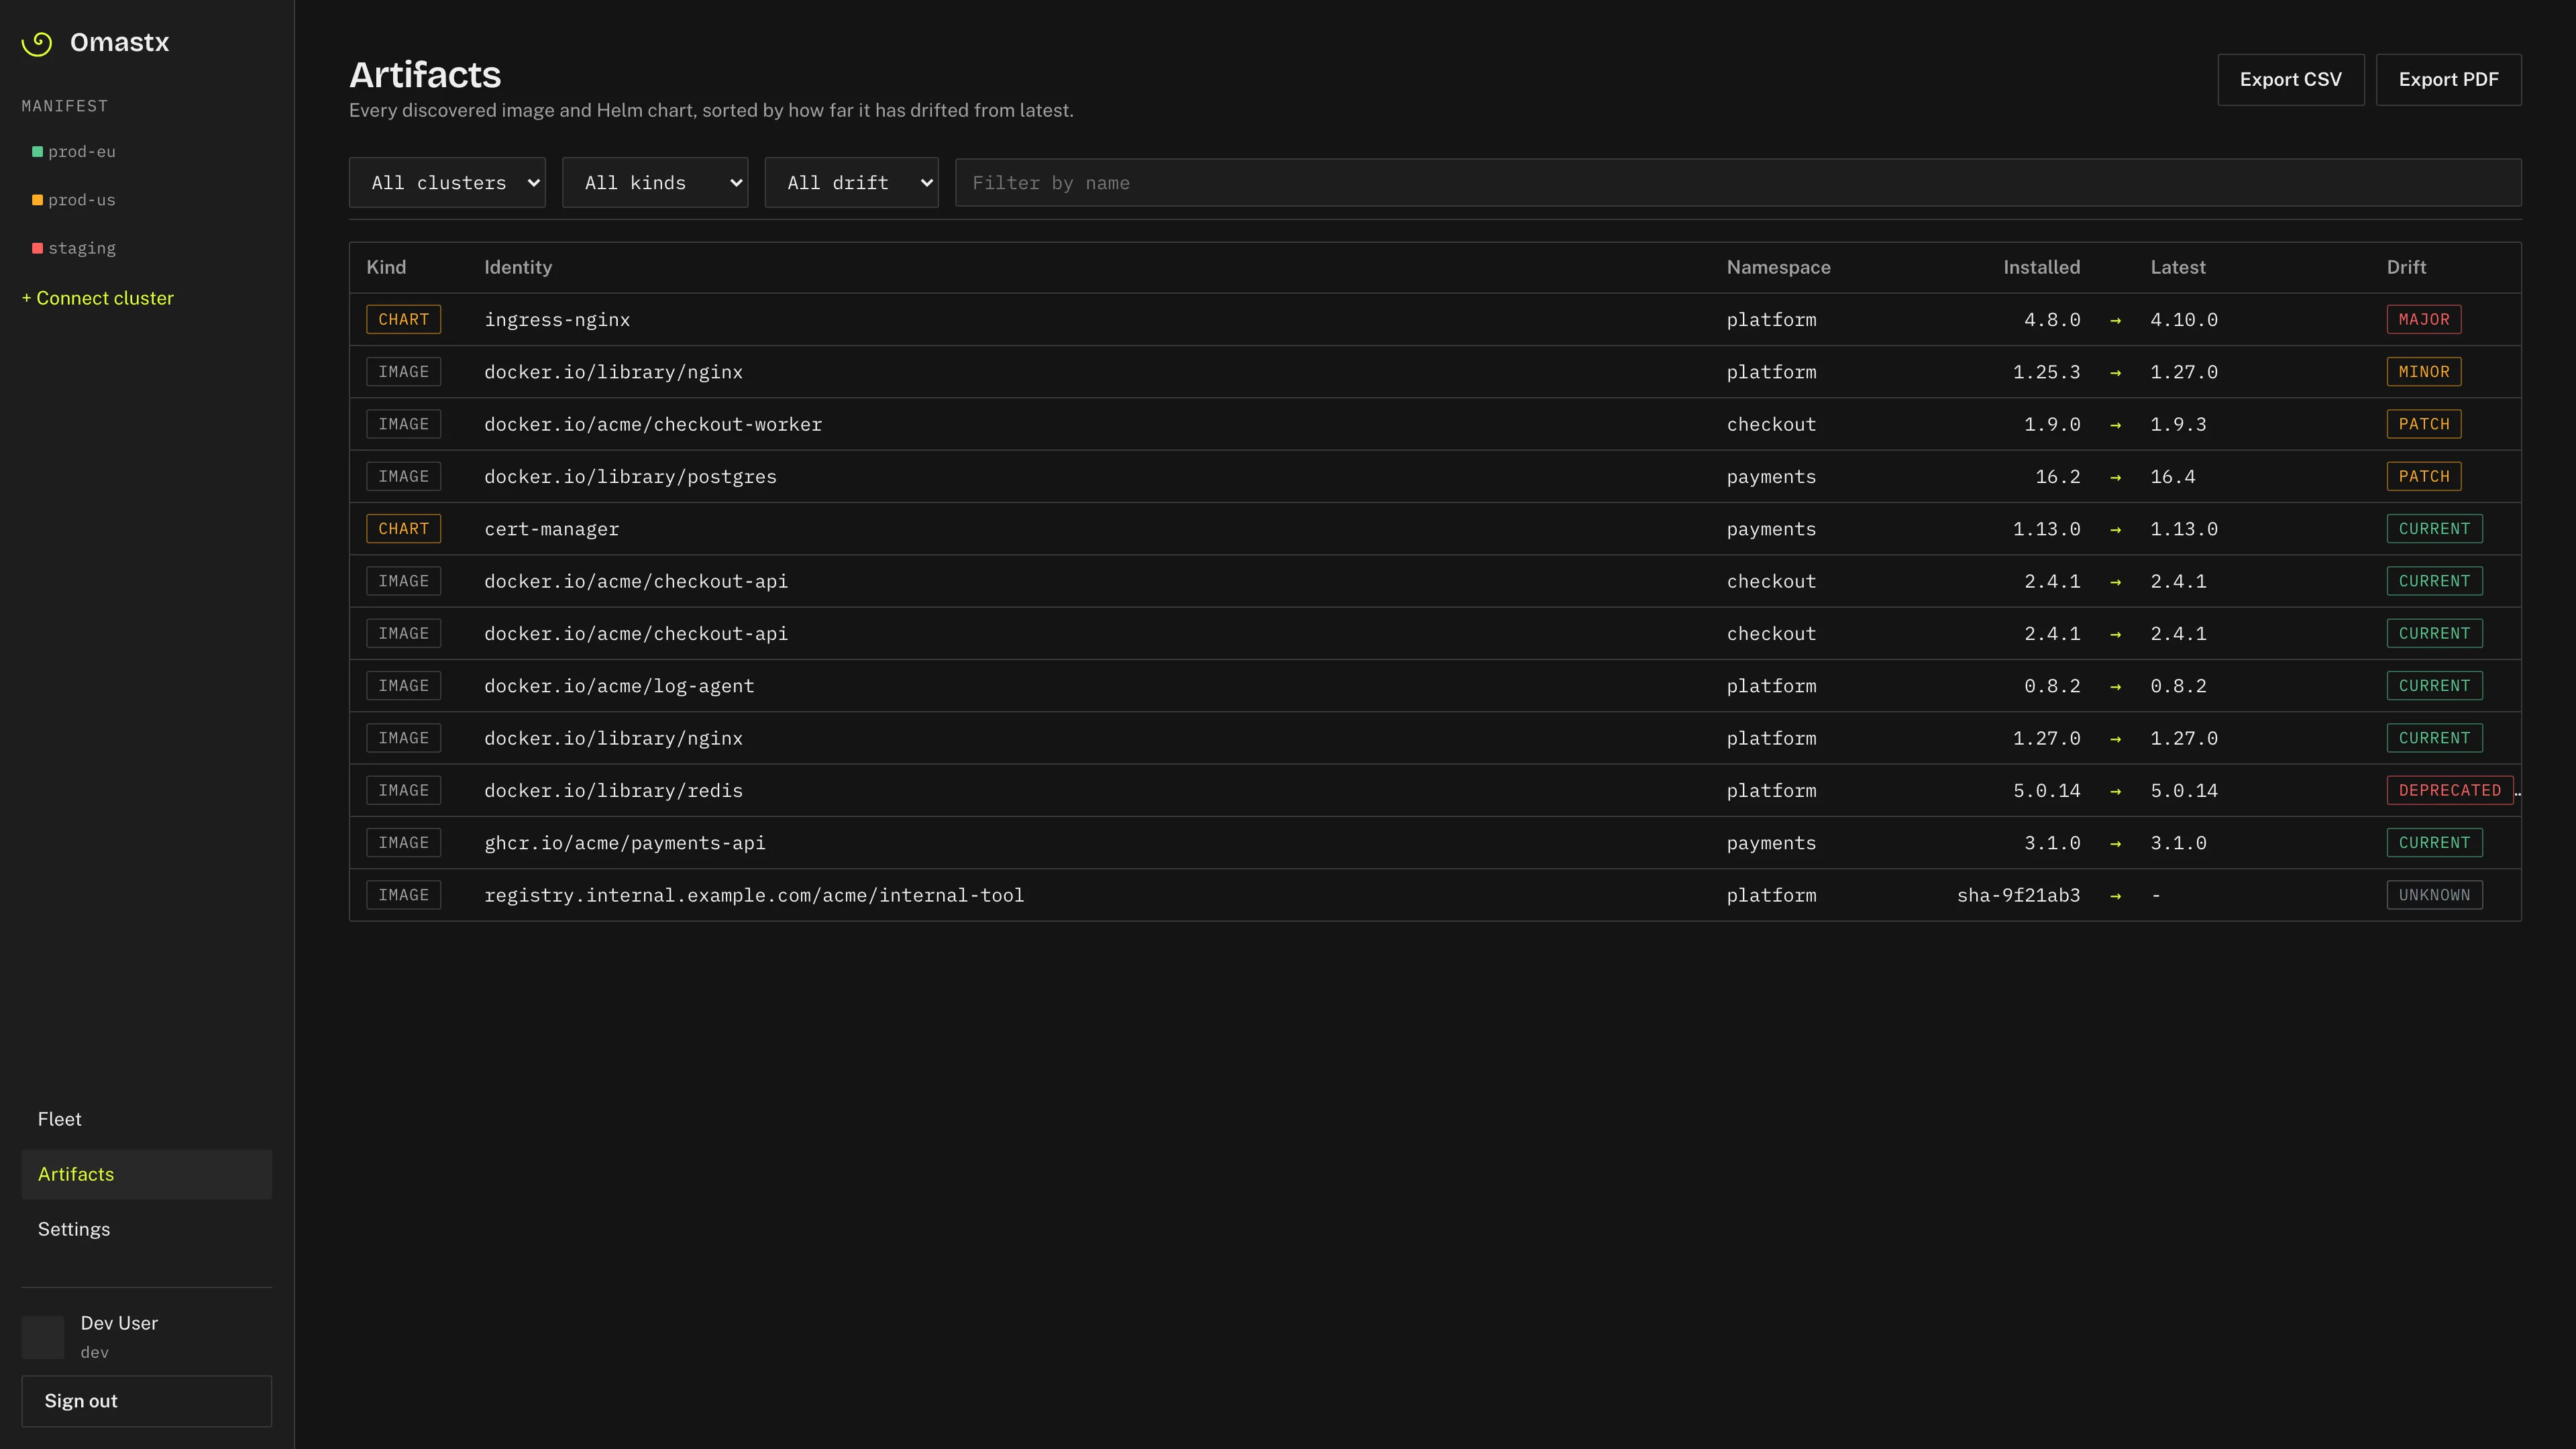 Artifacts page: ledger with filters and Export CSV / Export PDF buttons.
Click a row to open the artifact detail sheet: identity, registry or chart repo URL, match confidence for Helm, releases behind, history sparkline, and candidate versions when the tag channel allows a comparison.
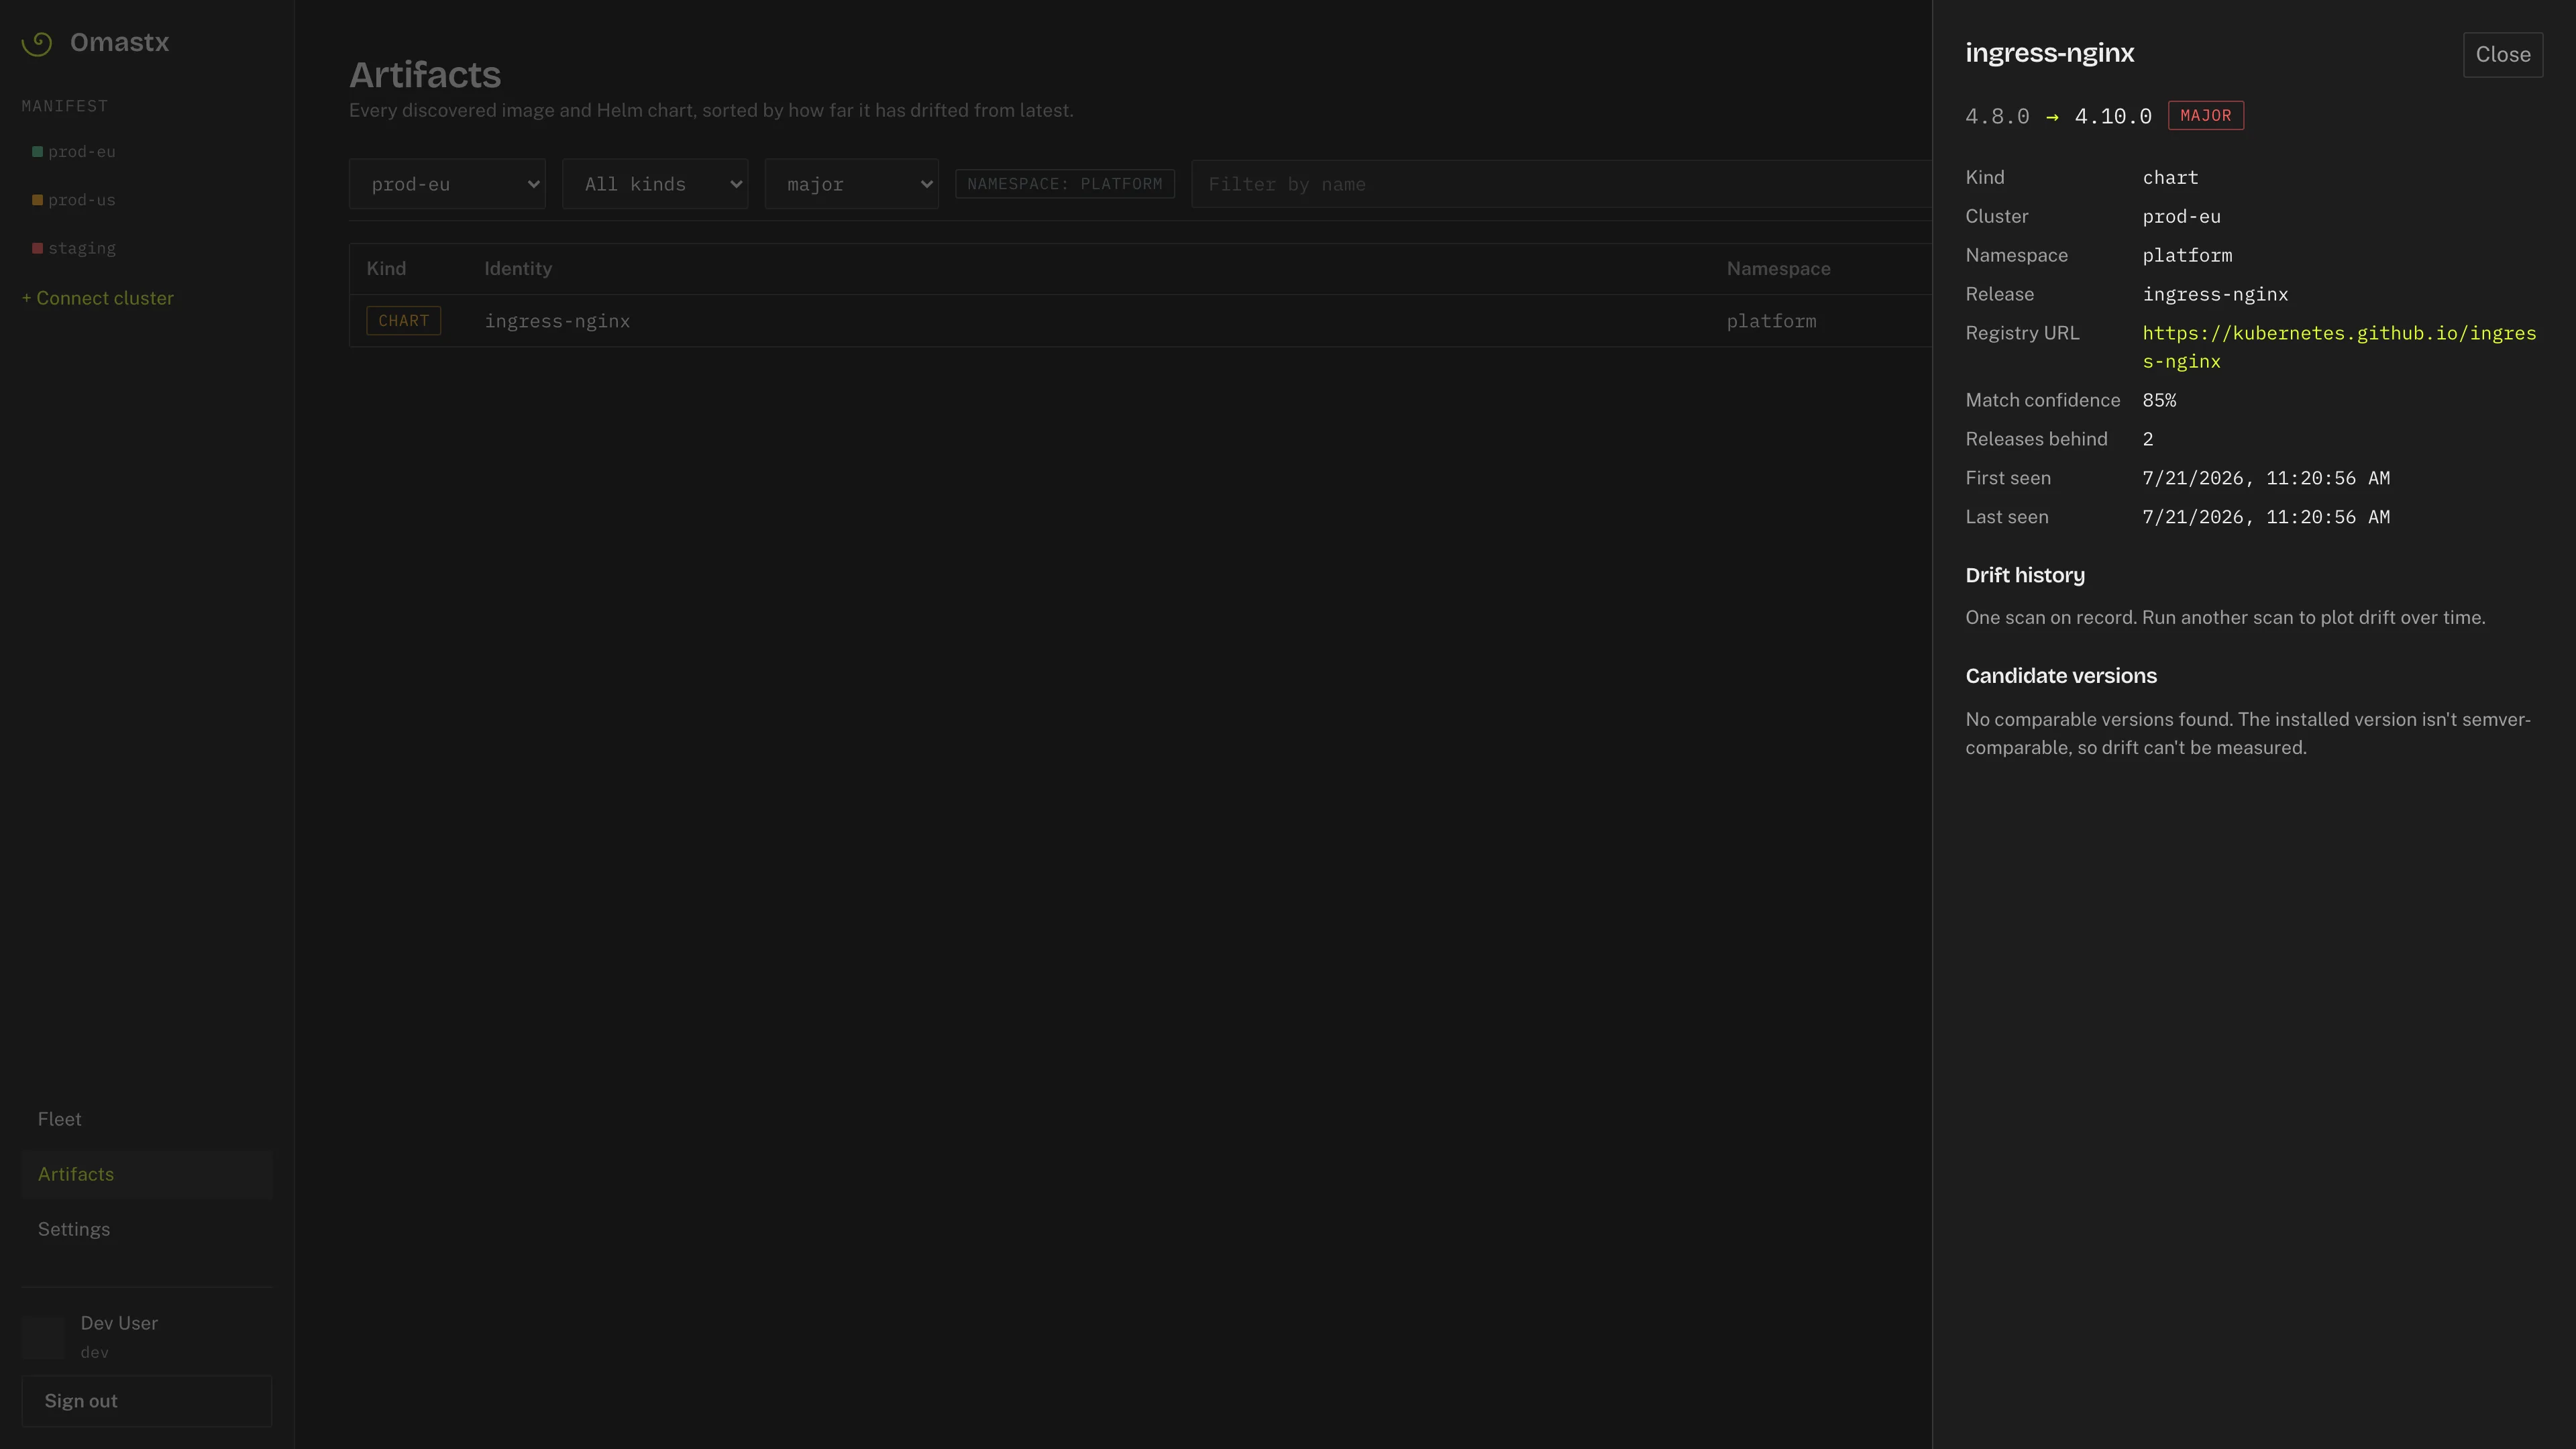 Drill-down: filter to major drift in a namespace, then open the sheet for installed → latest, confidence, and metadata.
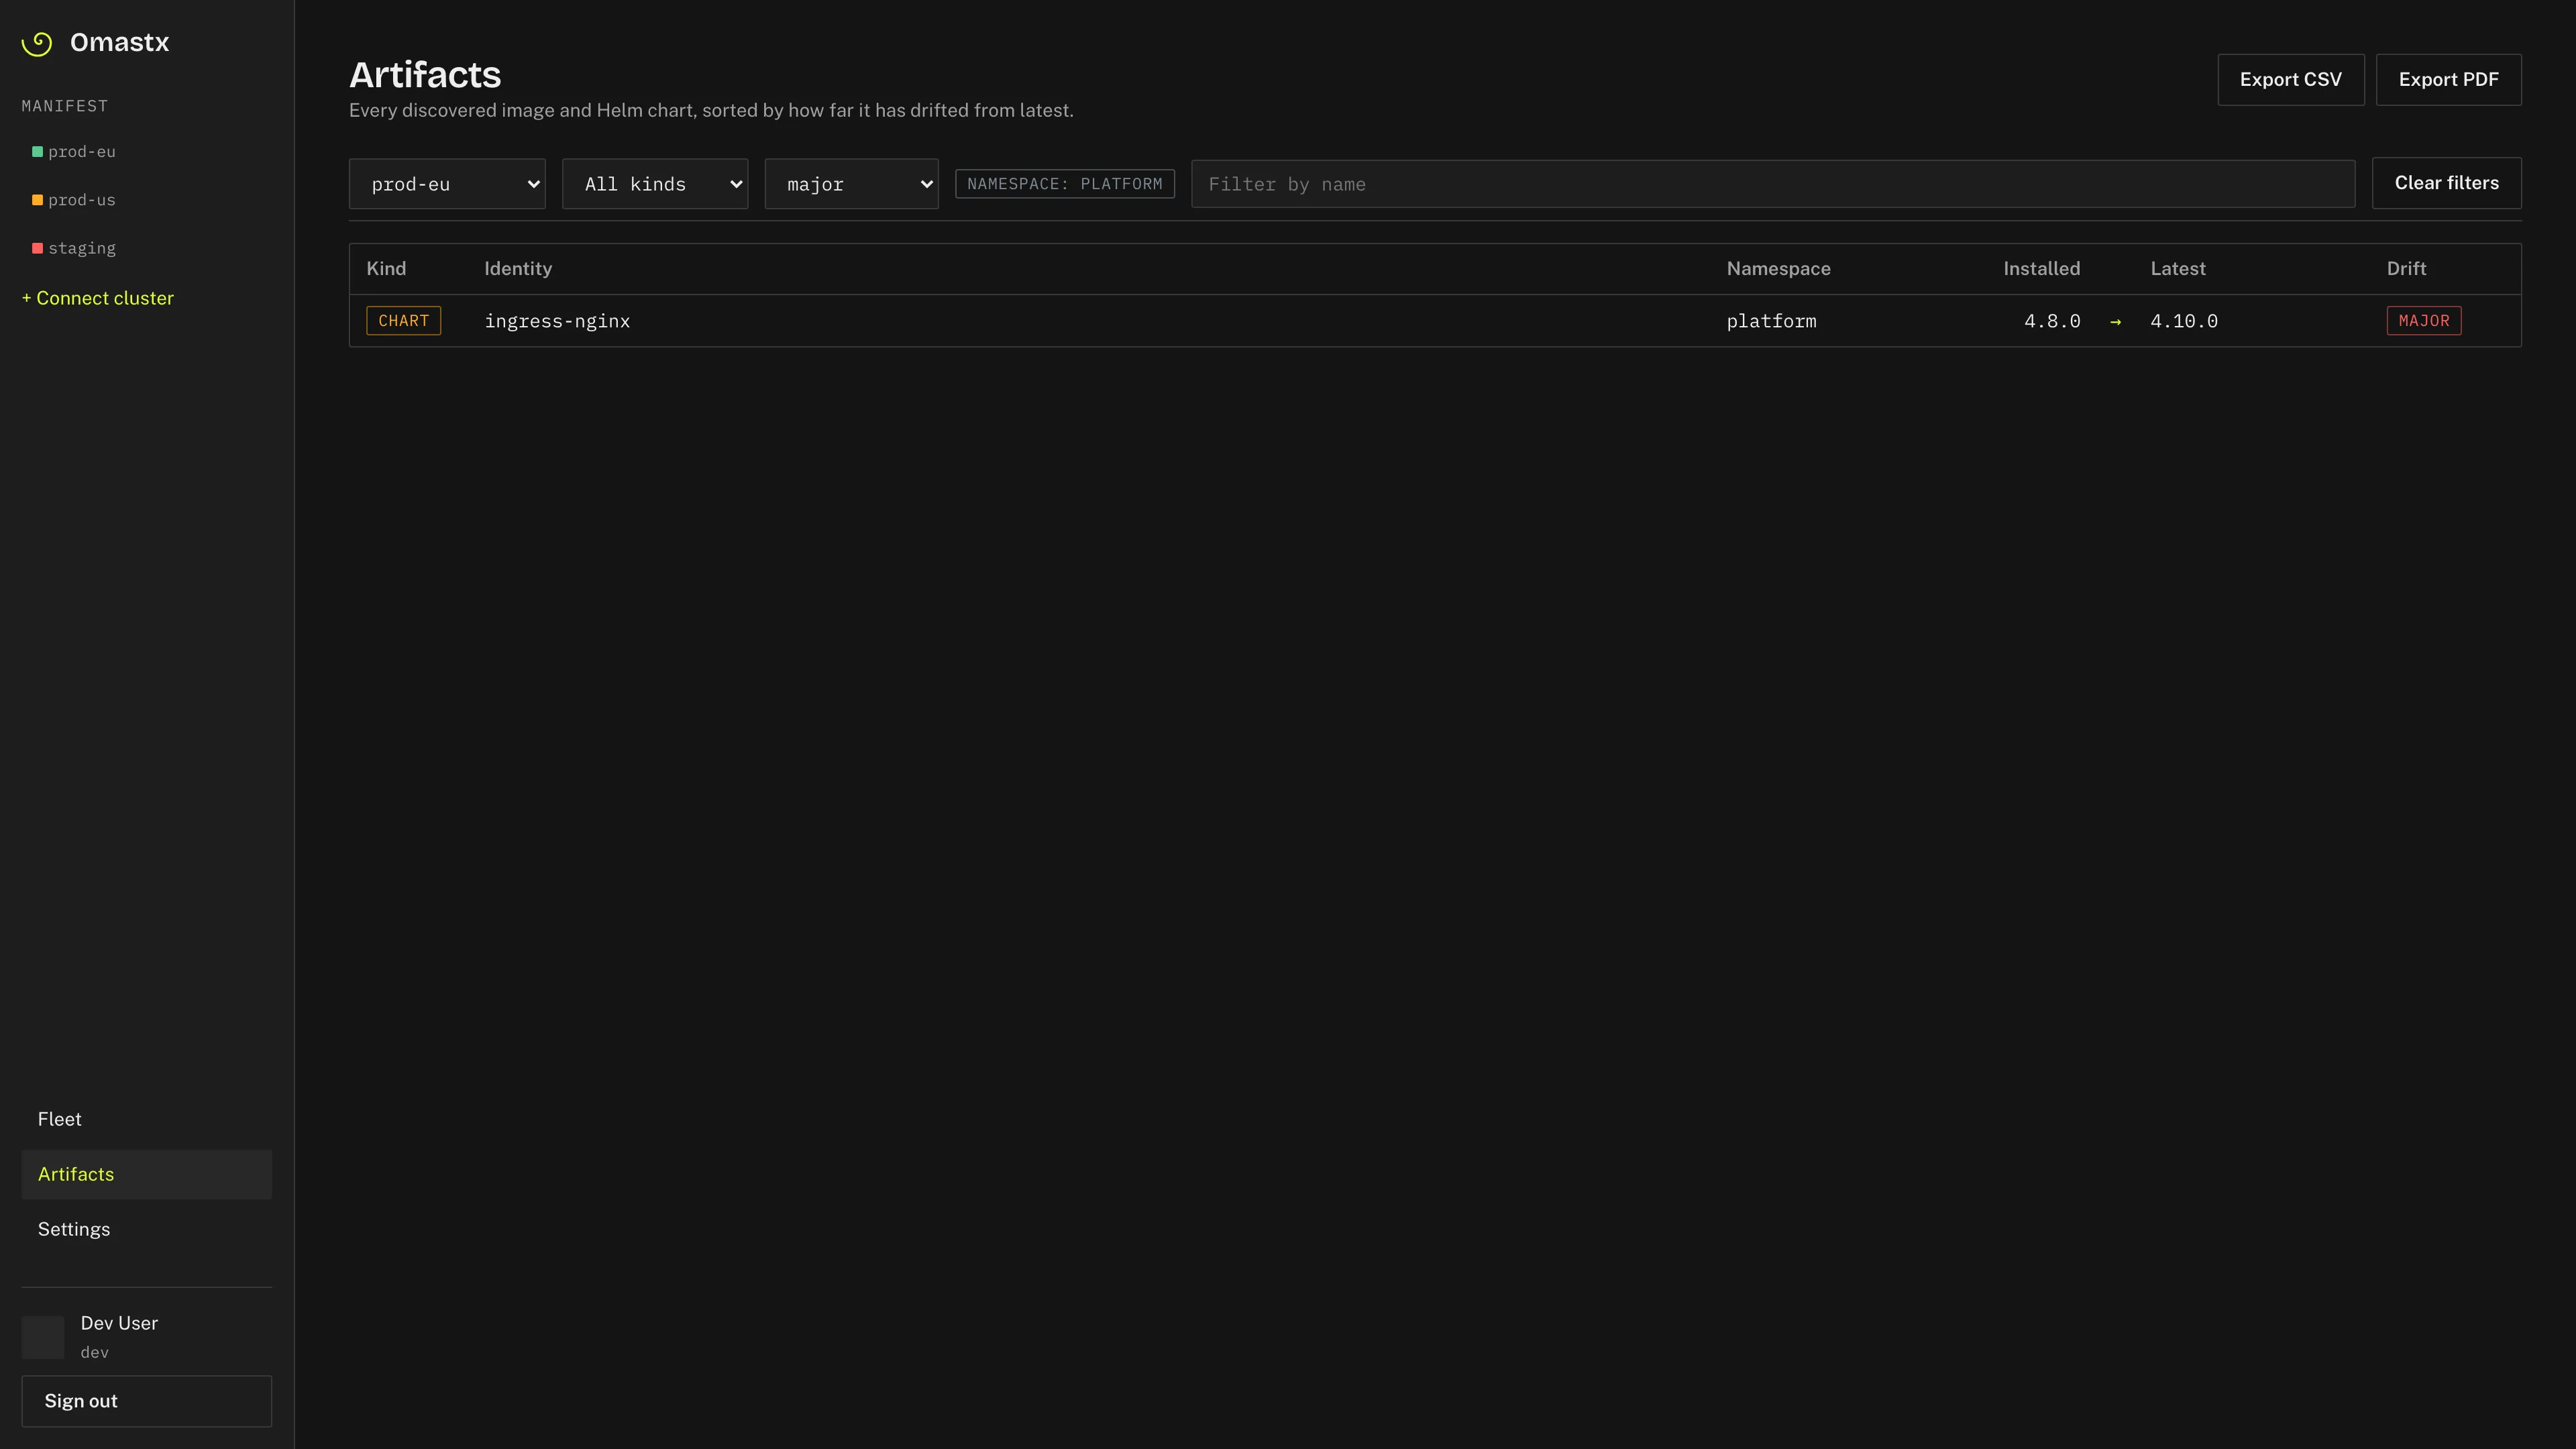 Same ledger after narrowing to one cluster, one namespace, and major drift only.
Connect a cluster is a guided flow to drop or paste a kubeconfig, pick contexts, then set a name and cron schedule for the scans.
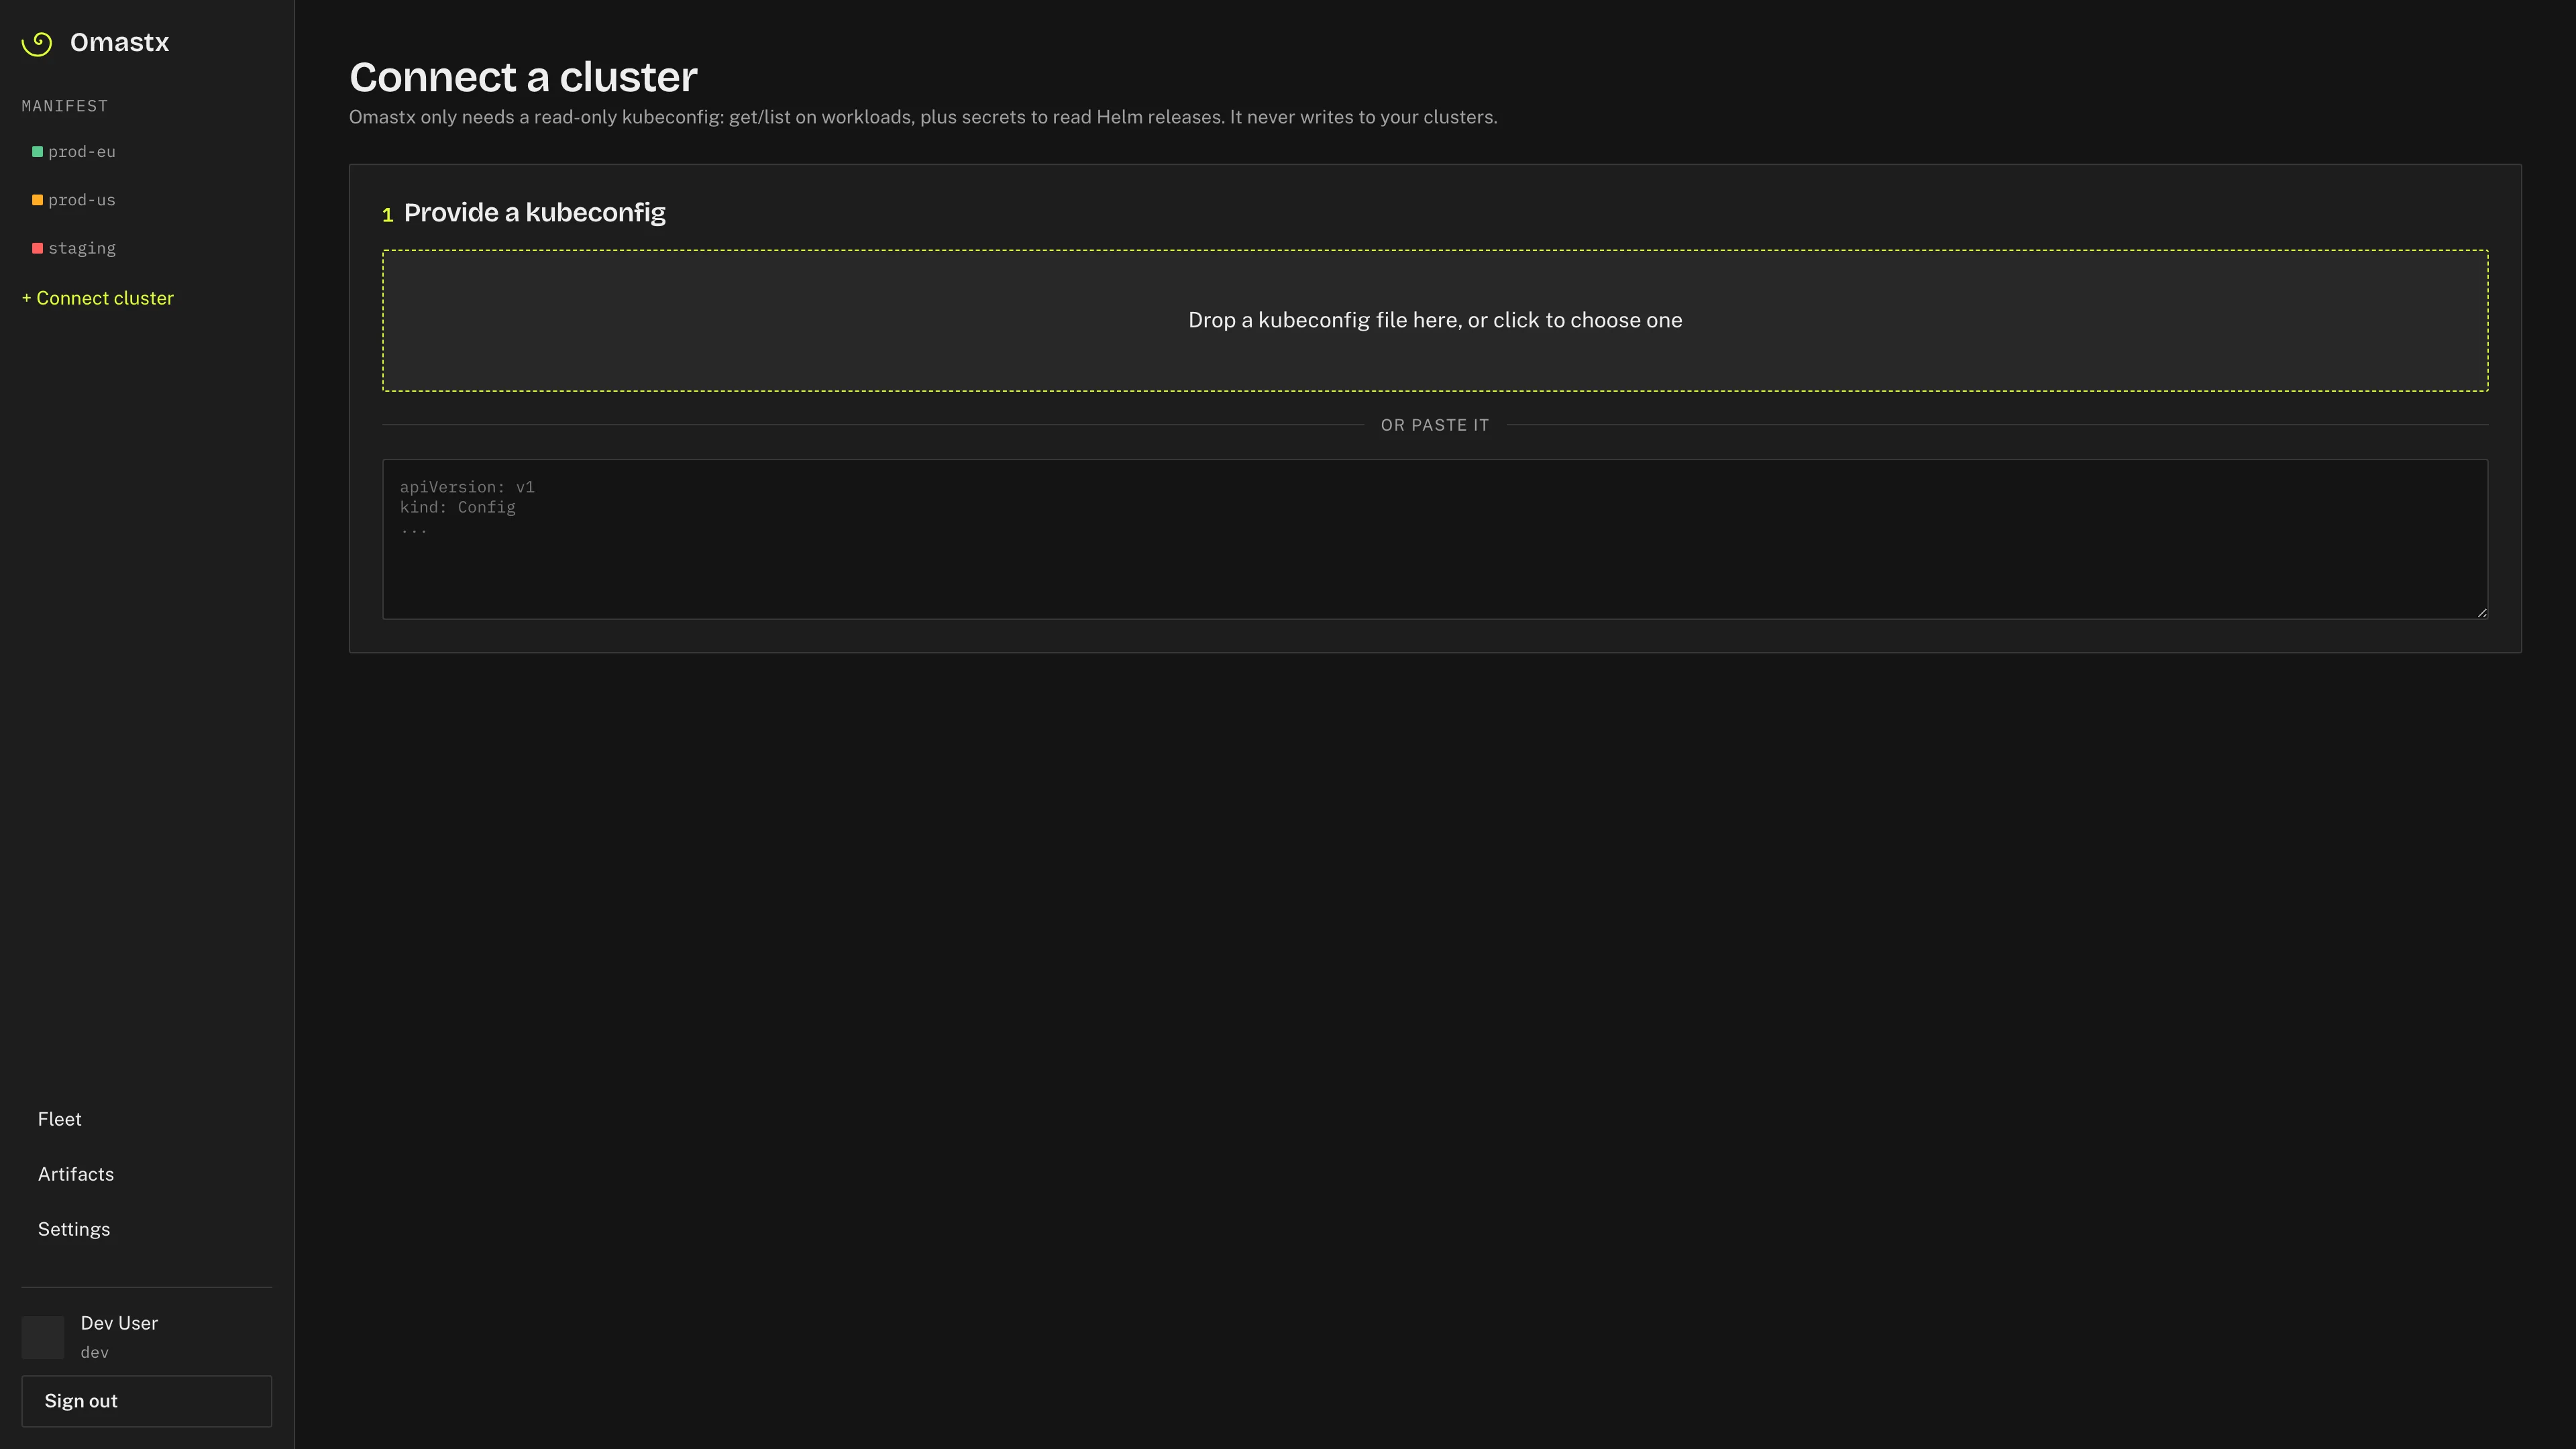 Connect flow: drop or paste a read-only kubeconfig; Omastx checks permissions before saving.
Credentials for private registries can be attached, for example, when drift is classified as Unknown and the artifact points at a host that requires authentication.
Machine API and MCP
Beside the UI, Omastx exposes a scoped Bearer API for scripts and AI agents. Admin actions (connect clusters, registry credentials) stay session-only. OpenAPI is at /api/openapi.yaml (also under docs/openapi.yaml in the repo).
1. Create an API token
- Sign in and open Settings → API tokens.
- Give the token a name, enable scopes
read(fleet, artifacts, scans) and/orscan(start scans). - Click Create token and copy the value once (
omx_…). It is never shown again.
Smoke-test the token with curl (Compose URL shown; use http://localhost:5173 or :8484 for native dev):
export OMASTX_URL=http://localhost:8080
export OMASTX_API_TOKEN=omx_…

curl -sS -H "Authorization: Bearer $OMASTX_API_TOKEN" \
  "$OMASTX_URL/api/fleet/summary" | jq .
2. Build the MCP server
The thin wrapper lives in mcp/ and calls the same REST API (no duplicated business logic, no kubeconfigs or registry secrets):
cd mcp
npm install
npm run build
That produces mcp/dist/index.js. It needs Node 20+ and two env vars: OMASTX_URL (site root, without /api) and OMASTX_API_TOKEN.
3. Configure Cursor (or any MCP host)
Add an entry to your MCP config (Cursor: project or user mcp.json). Use the absolute path to dist/index.js:
{
  "mcpServers": {
    "omastx": {
      "command": "node",
      "args": ["/absolute/path/to/omastx/mcp/dist/index.js"],
      "env": {
        "OMASTX_URL": "http://localhost:8080",
        "OMASTX_API_TOKEN": "omx_…"
      }
    }
  }
}
Reload MCP servers in the host. Tools available: fleet_summary, list_clusters, get_cluster, list_artifacts, get_artifact, artifact_history, start_scan, list_scans, export_artifacts.
4. Test the MCP layer
With Omastx running and at least one cluster connected, ask the agent (or call the tools) in this order:
fleet_summarythenlist_clusters- confirm your cluster appears and status looks right.list_artifactswith that cluster’s id - expect a page of images/charts with drift classes.start_scanon the cluster id, thenlist_scansuntil status isdoneorerror(agents poll; the UI can also follow SSE).- Optional:
export_artifactswithformat=csvfor a text export of the filtered ledger.
Example prompts: “Summarize fleet drift”, “List major-drift artifacts on cluster X”, “Start a scan on cluster X and tell me when it finishes”.
If a tool returns 401, recreate the token. 403 / insufficient_scope means the token is missing read or scan. Admin routes are intentionally unavailable over MCP.
Requirements
- Docker + Compose (quickest path), or Go 1.26+ and Node 20+ for native development
- PostgreSQL (bundled in Compose; external for typical Helm installs)
- A read-only kubeconfig per cluster (get/list on workloads; secrets for Helm release discovery)
- For production: a GitHub OAuth App and membership in the configured GitHub org (or your username for a solo install)
Preparation steps
1. Clone the repository
git clone https://github.com/banshee86vr/omastx.git
cd omastx
2. Start locally with Docker Compose
make dev # or: docker compose -f deploy/docker-compose.yml up --buildOpen http://localhost:8080. In this mode you are signed in automatically (no credentials or .env file required).
3. (Optional) Native development with hot reload
For day-to-day coding, run Postgres in Docker and the API + Vite on the host:
make dev-localOpen http://localhost:5173. Vite proxies /api to the backend on :8484 and signs you in automatically.
4. Connect a cluster and scan
In the UI, open + Connect cluster, drop a read-only kubeconfig, select the contexts to import, confirm the permission check, and set a scan schedule. Click Scan now on the cluster page (or wait for the cron). When the scan finishes, the Fleet headline and drift lanes update; open Artifacts to walk the ledger.
5. (Optional) Seed demo data
To explore the UI without a real fleet, the repository includes a seed path used for the screenshots in this article (make seed / the article capture script under docs/screenshots/article/).
Architecture (in short)
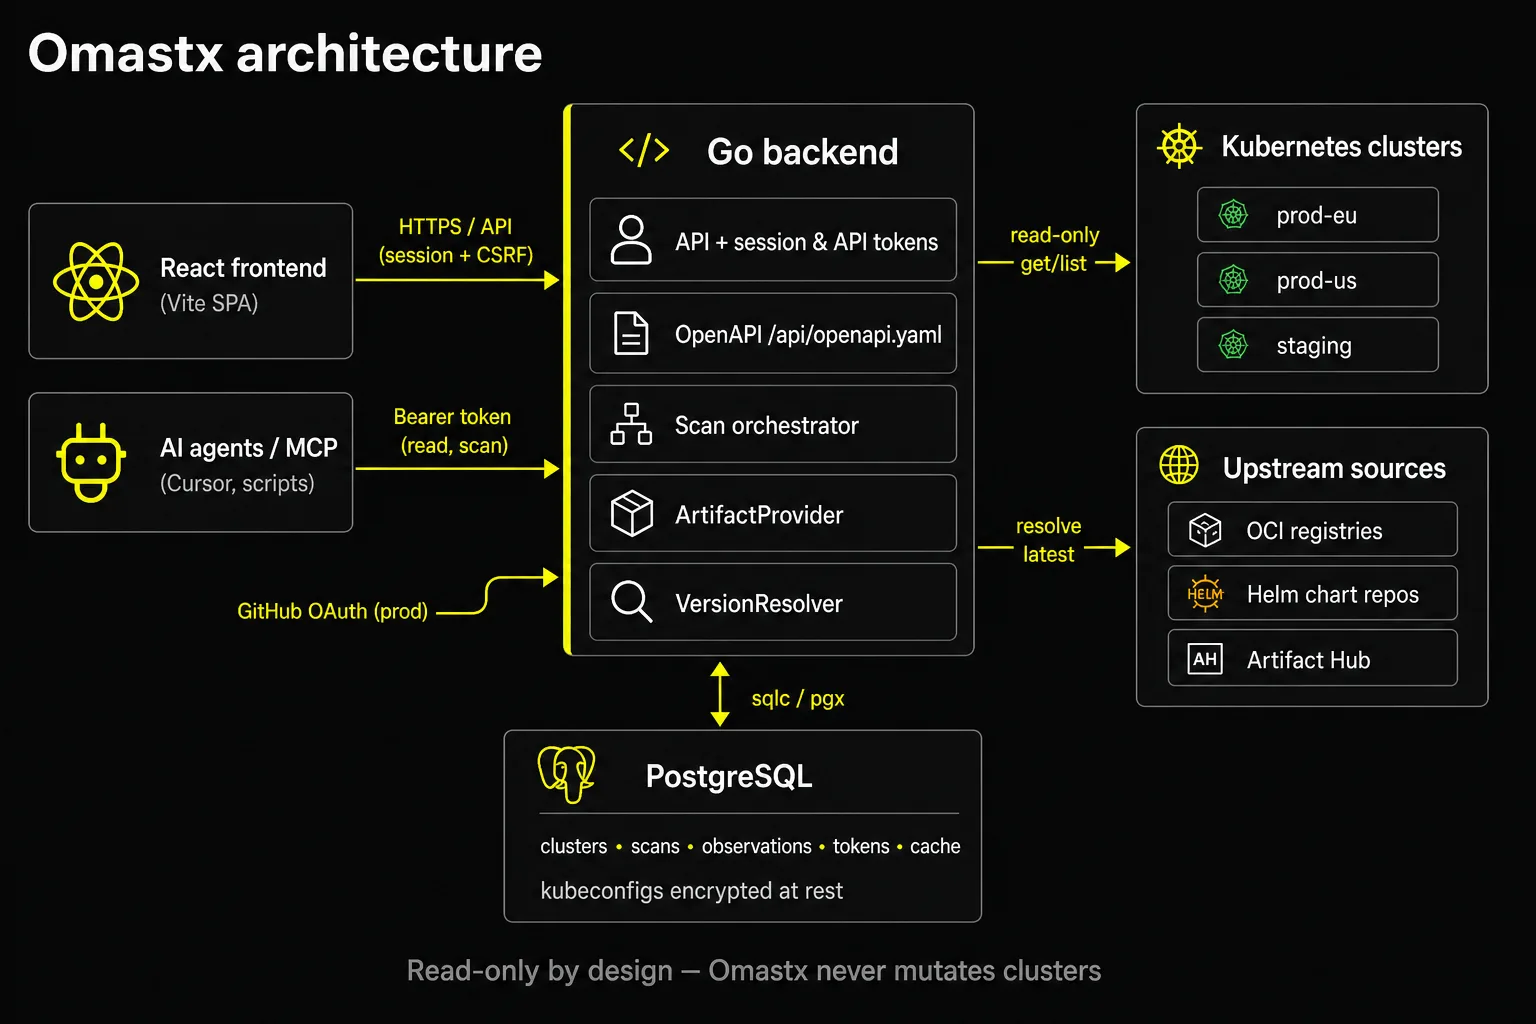 React SPA (session + CSRF) and AI agents/MCP (Bearer read/scan), Go backend with OpenAPI, scan orchestrator and pluggable providers/resolvers, PostgreSQL (including API tokens), read-only cluster discovery, and latest-version resolve from OCI registries, Helm repos, and Artifact Hub.
Docker Compose
The Compose stack under deploy/docker-compose.yml builds and runs Postgres, the Go API, and the nginx-fronted frontend. Images for releases are published to GitHub Container Registry: ghcr.io/banshee86vr/omastx-backend and ghcr.io/banshee86vr/omastx-frontend.
make dev          # build and start
# open http://localhost:8080
Deploying to Kubernetes
Omastx ships a Helm chart in deploy/chart/omastx. Create a Secret with the master key, GitHub OAuth credentials, org gate, base URL, and database URL, then install with existingSecret (values never template secrets inline).
Register a GitHub OAuth App with callback ${OMASTX_BASE_URL}/api/auth/github/callback. Only members of OMASTX_GITHUB_ORG can sign in.
kubectl create secret generic omastx \
  --from-literal=OMASTX_MASTER_KEY=$(openssl rand -hex 32) \
  --from-literal=OMASTX_GITHUB_CLIENT_ID=... \
  --from-literal=OMASTX_GITHUB_CLIENT_SECRET=... \
  --from-literal=OMASTX_GITHUB_ORG=your-org \
  --from-literal=OMASTX_BASE_URL=https://omastx.example.com \
  --from-literal=DATABASE_URL=postgres://user:pass@host:5432/omastx

helm install omastx deploy/chart/omastx --set existingSecret=omastx
For a throwaway test install with bundled Postgres:
helm install omastx deploy/chart/omastx \
  --set existingSecret=omastx --set postgres.internal.enabled=true
The chart runs non-root containers with hardened security contexts; the product itself never requests Kubernetes write permissions on the clusters it monitors.
Bottom line
With make dev you get a portal that answers one question for your whole fleet: how many fossils will we find on our clusters? Connect read-only kubeconfigs, scan on a schedule, check the drift classes on the chart, and drill into every image and Helm chart in the ledger, or ask an AI agent over MCP for the same read/scan surface. Open-source and no write path into your clusters. For anyone running more than one Kubernetes environment, Omastx is the drift view that kubectl and helm list never aggregate for you.
Tags